
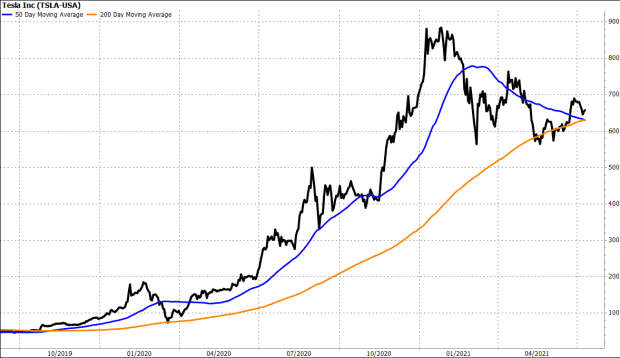
Tesla’s 50-DMA is set to end a 20-month run above the 200-DMA, which could be a warning of further losses for the stock.
Tesla Inc.’s stock chart has produced the first bearish “death cross” pattern in more than two years on Friday, which some market technicians could view as a warning of further losses.
The electric vehicle industry leader’s stock TSLA, +0.63% rose 0.6% to close at $656.95, seesawing from a loss of as much as 1.2% and gain of as much as 0.9% in intraday trading.
The 50-day moving average (DMA), which many Wall Street chart watchers use as a guide to the shorter-term trend, fell to $629.66 from $630.44 at Thursday’s close.
Meanwhile, the 200-DMA, which is viewed by many as a dividing line between longer-term uptrends and downtrends, rose to $630.76 from $629.61.
That snapped a 20-month streak in which the 50-DMA has closed habove the 200-DMA.
The point where the 50-DMA crosses below the 200-DMA is referred by technical analysts as a “death cross,” which many believe marks the spot a shorter-term pullback evolves into a longer-term downtrend.
Death crosses aren’t usually seen as good market timing tools, given that their appearances are telegraphed far in advance. To some, they only represent an acknowledgment that a stock’s pullback has lasted long enough and/or extended far enough to consider shifting the narrative on the longer-term outlook.
Tesla’s stock hasn’t closed at a record since Jan. 26, and closed Friday about 26% below its record of $883.09. Meanwhile, other Nasdaq-listed megacapitalization stocks like Apple Inc. AAPL, +1.31%, Microsoft Corp. MSFT, +0.19%, Amazon.com Inc. AMZN, -0.32% and Alphabet Inc. GOOGL, +0.38% have all set fresh records this week, and Facebook Inc. FB, +1.38% shares closed at a record last week.


